The Whole is Greater Than the Sum of its Parts

Getting into systematic short-term options trading taught me a lot about risk and risk management. One of the most valuable lessons came from the immediacy of feedback - sometimes the results were great, other times they got quite ugly. But what truly fascinated me was discovering how versatile I could be in spreading risk across multiple strategies, even while trading only SPX options. That realization was a real game changer for me. It pushed me to dig deeper, rethink my portfolio structure, and place much greater emphasis on diversification.
While the concepts discussed in this post apply to all types of investors, my personal trading style revolves around short-term options trading - primarily in SPX 0-7DTE strategies. In this domain, capital is constantly being reallocated as positions open and close within hours or days. This faster turnover allows compounding to occur more frequently, and any true edge (if it exists) tends to reveal itself much sooner. It’s a faster feedback loop - one that amplifies both strengths and weaknesses in a strategy. This matters most with percentage-based allocation, where every change affects the base you’re compounding from.
The Holy Grail
In trading and investing, we usually tend to over-emphasize the importance of one “perfect” strategy. We obsess over finding that one “best” system - usually optimizing it to death with filters, indicators, and curve-fitted parameters.
Once we think we’ve found that holy grail, we throw all our money at it and wait for the magic to happen.
Then reality hits: volatility, losing streaks, and drawdowns.
We get scared, reduce size, or quit altogether - often at the worst possible time, locking in a loss that could have been anticipated if we’d only looked at the system’s historical drawdowns.
Weeks or months later, we look back and realize the strategy actually performed fine.
It stayed within its statistical limits.
But we couldn’t survive its 30 % drawdown - because we sized too big and didn’t have risk in mind.
You might say:
“But if I had sized smaller, I’d never reach that 50 % annual return I was promised by MillionDollarGuru23!”
Fair enough - but math doesn’t care about your ambition.
When you increase your exposure, both wins and losses are amplified equally - a 50% CAGR with a 30% drawdown might look great on paper, yet in real life it’s incredibly hard to live through (and, as we’ll see - not necessary and should probably be avoided).
A 30% drop means your account has to climb 43% just to break even.
That takes time, patience, and nerves of steel - and most traders don’t have enough of any.
It’s not that the strategy stopped working; it’s that you stopped believing in it when it hurt the most - because you wanted more, and faster.
That’s how good systems die in real accounts.
There’s only so much edge you can squeeze out of a single strategy before the risk becomes too hot to handle.
Turning Up the Volume?
Let’s take a hypothetical daily equity curve of one great strategy starting from a $100,000 account.
For simplicity, we’ll look at one-year data samples - but ideally, you’d use much longer periods and larger datasets for any serious backtest or analysis. You’ll also notice we’re using CAGR even though the sample is only one year long - that’s just to stay consistent when calculating the MAR, which is usually based on CAGR. In this case, the total net return, average annual gain, and CAGR are effectively the same.
Each trade uses 1 % of the portfolio.
The system achieves:
- CAGR: 22.8 %
- Max Drawdown: 13.8 %
- MAR = 1.6
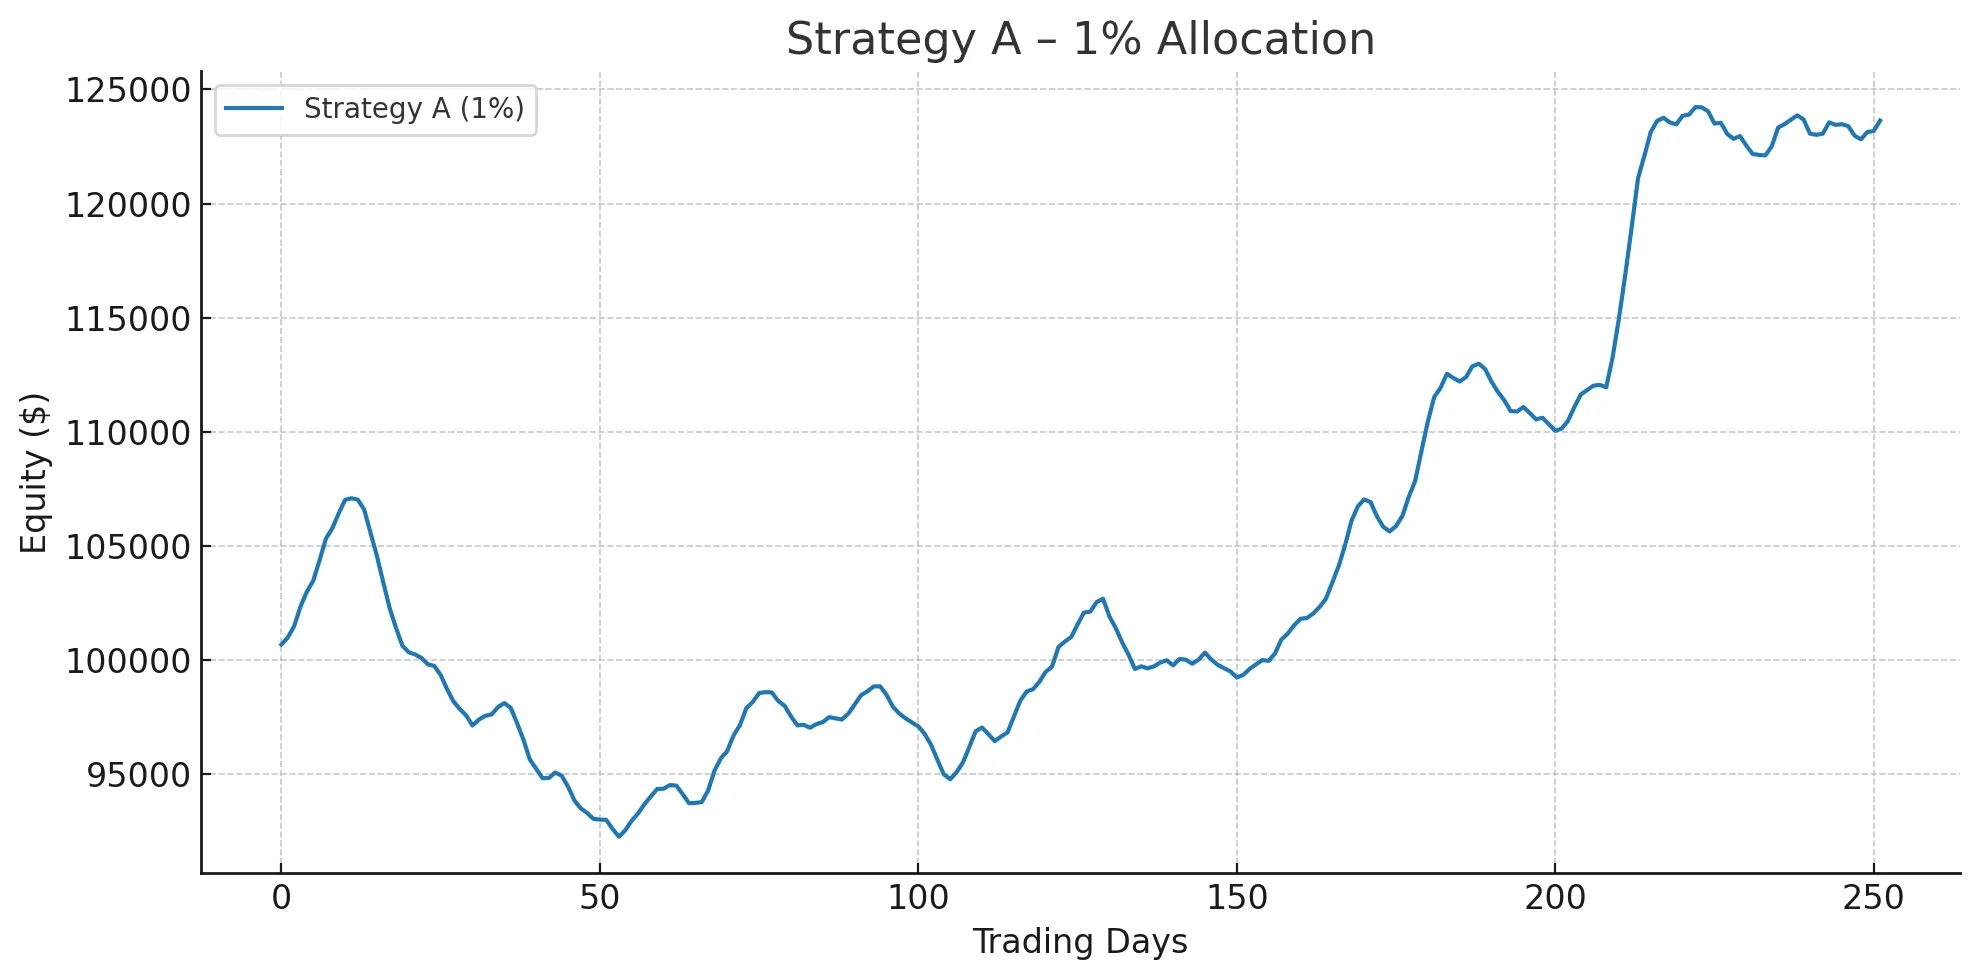
Not bad generally although crossing to the other side of that first drawdown might test your patience a bit.
Now let’s turn up the volume - allocating 5% per trade.
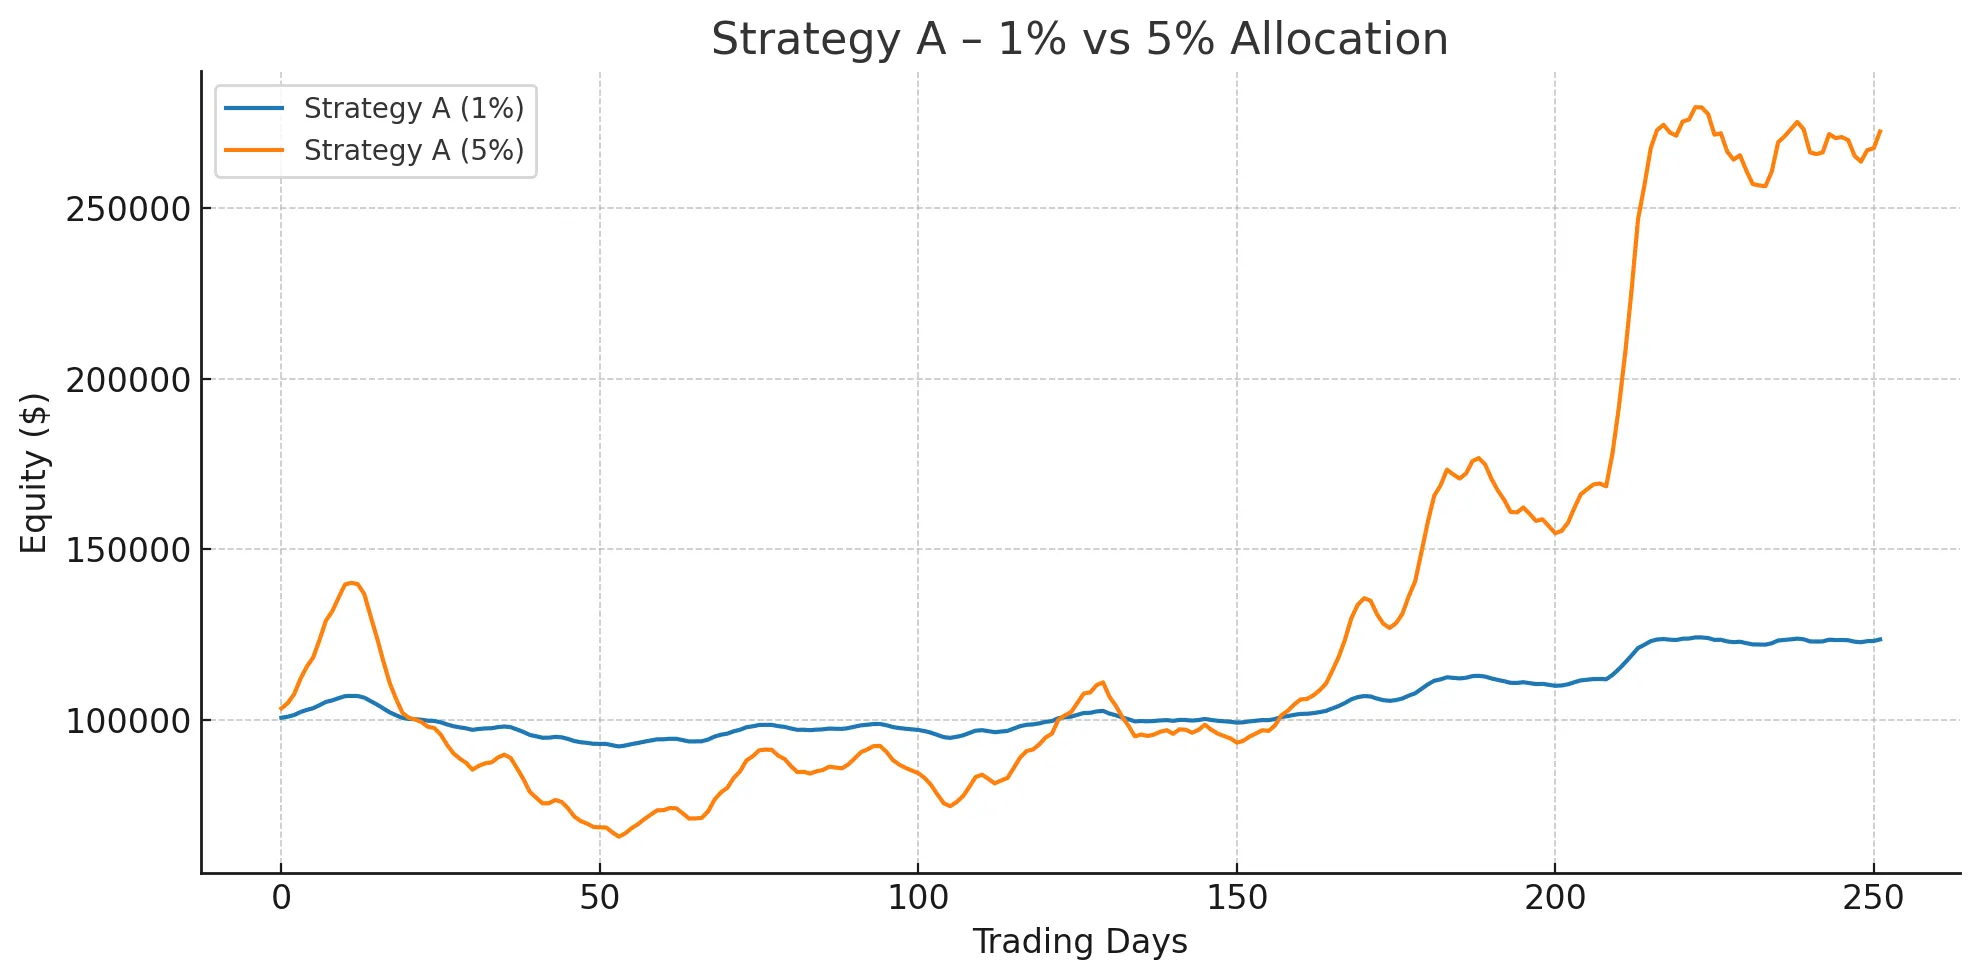
Returns grow faster and bigger - but so do the drawdowns.
CAGR rises to an eye-catching 163.5%, and though the Max Drawdown deepens to around 53.1%, the MAR actually improves to 3.08. Statistically, everything looks fine.
In practice though, a 53% drawdown feels nothing like 13.8% (which is hard enough for the average joe). It’s the difference between a manageable setback and watching half of your money disappear. Far fewer traders can stay in their seats long enough to enjoy the compounding that follows.
Another Strategy?
Let’s look at another strategy and see if we could get more out this one instead.
With just a 1% allocation, the system delivers:
- CAGR: 34.4 %
- Max Drawdown: 17.6 %
- MAR = 1.95
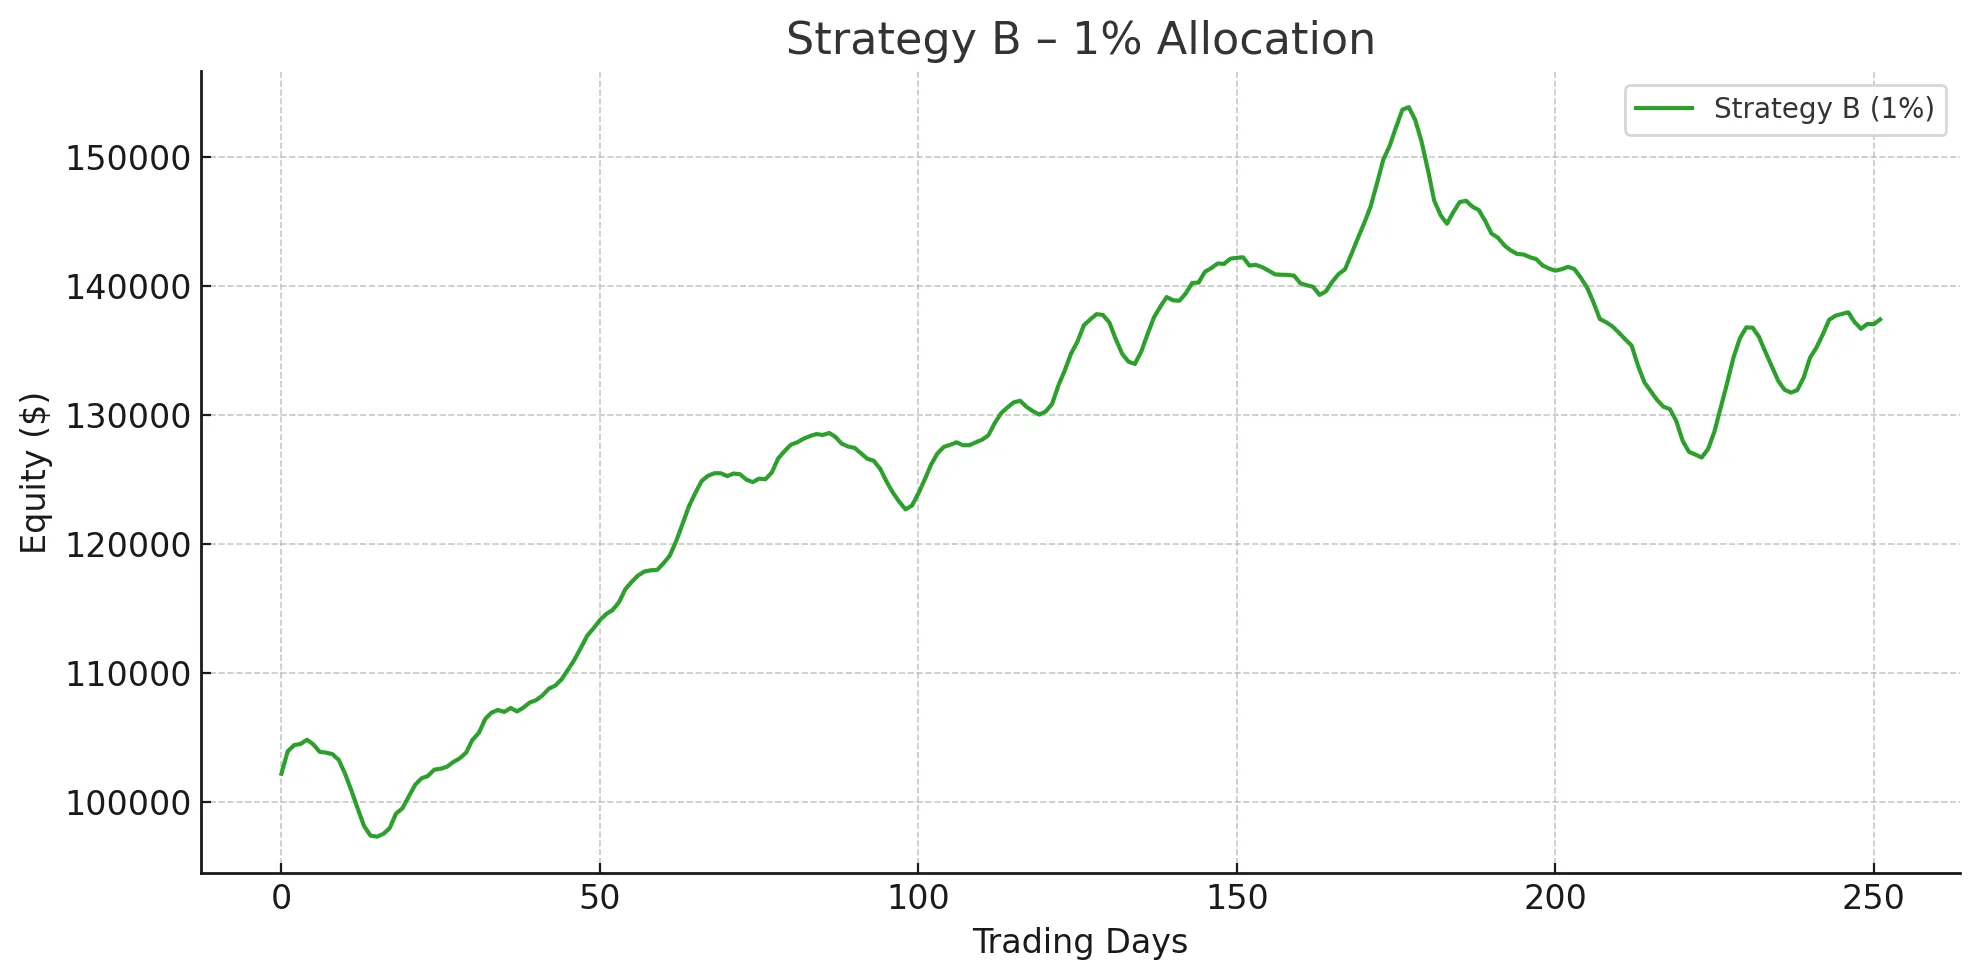
This one is better than the first - not just generating higher net gains for the given period, but doing so with a better reward to risk ratio. With that said, the drawdown is bigger and harder to deal with.
Increasing the allocation to 5%, the backtest shows the following results:
- CAGR: 301 %
- Max Drawdown: 62 %
- MAR = 4.7
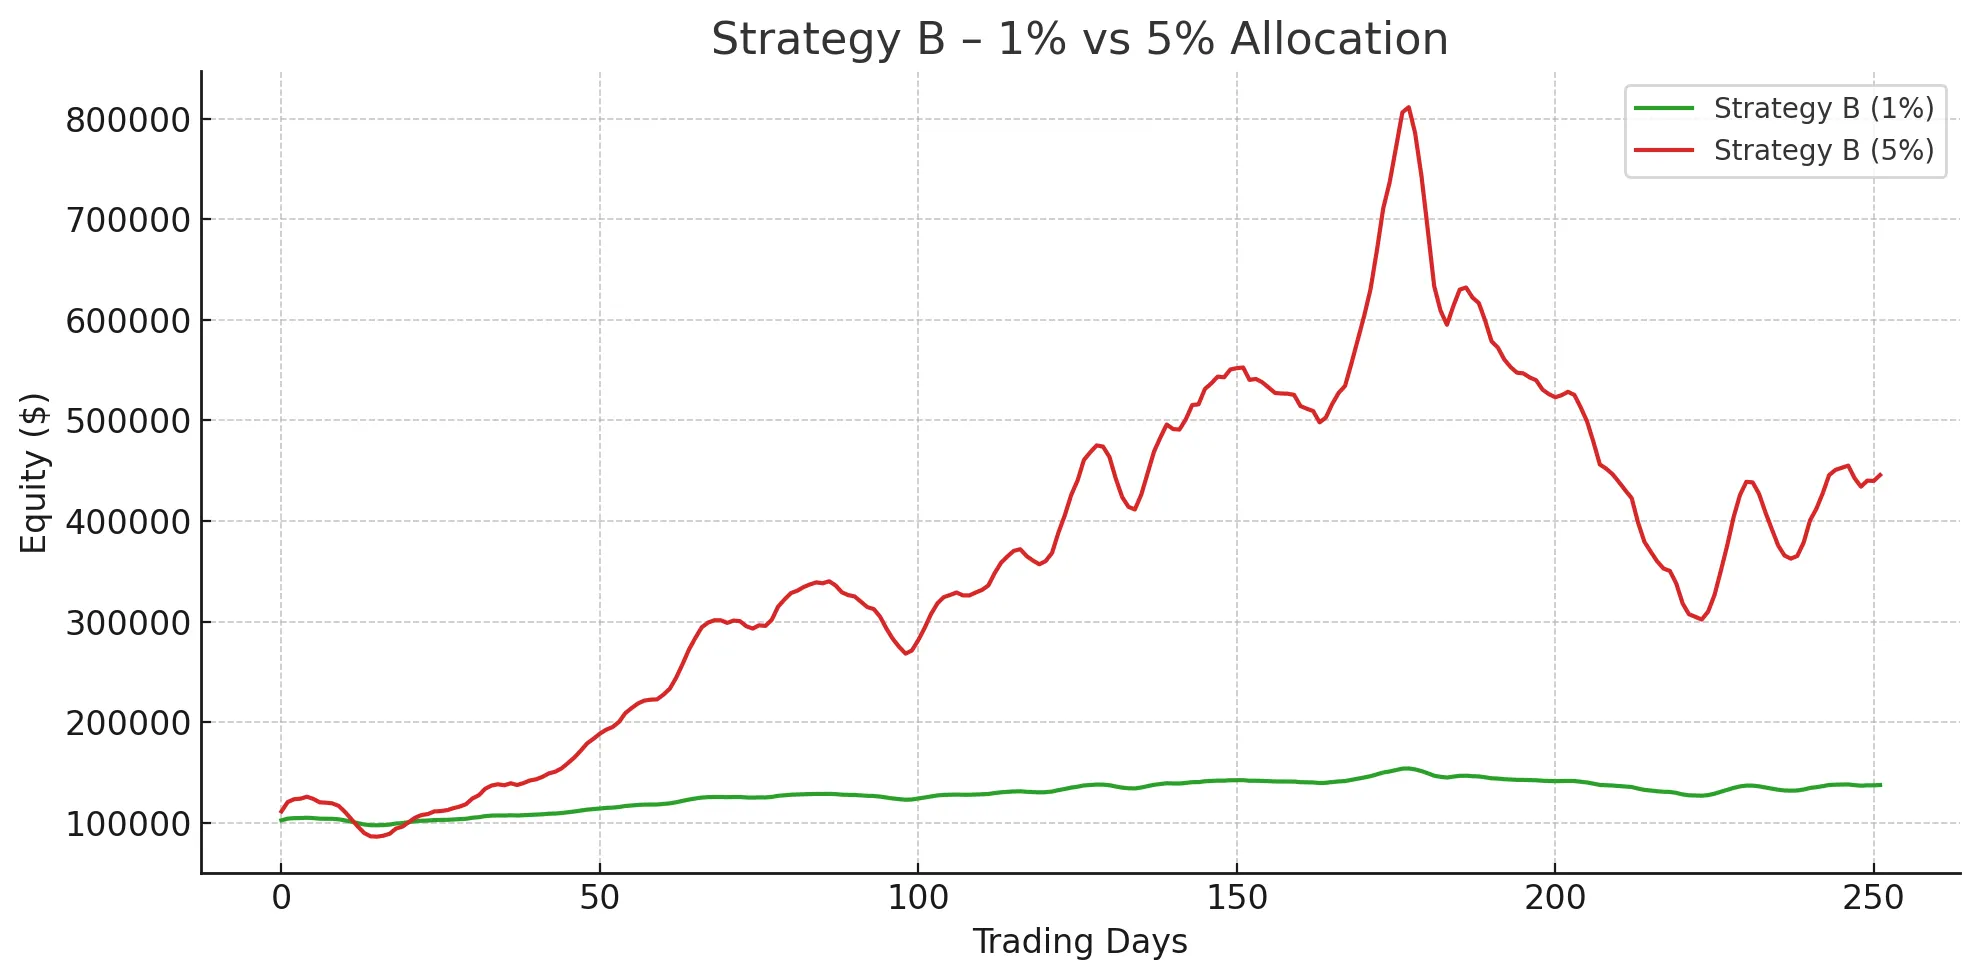
Instead of getting blinded by the astonishing 301% gain, we’ll takes a step back and give the 62% max drawdown the attention it deserves.
Taking that hit simply isn’t worth the thrill, no matter how impressive the returns look on paper.
The message should be clear by now: no single strategy is perfect. Each has its own limitations and behaves differently as market regimes shift - allocating more to any one of them only makes the volatility harder to endure and requires way more gains just to recover to break-even.
A Smarter Path
Now, what if I told you that you shouldn’t immediately dismiss these strategies just because you can’t throw all your money at them and expect a miracle?
Maybe, after proper backtesting and understanding the ugly sides of these strategies, you could even add them to your portfolio - this time, sizing for risk, not for reward.
The key shift: stop treating any single strategy as the path to wealth.
Instead, use diversification and the power of de-correlation to achieve more reward for the same or less risk.
Instead of doubling down on just one system, we might try to combine both of the strategies - assuming they’re both positively expectant and uncorrelated. If one tends to perform well when the other struggles, using them together could lead to a smoother, more resilient equity curve.
Let’s take a look at what happens when we combine both strategies into a single portfolio, keeping each one at its original 1% allocation.
| Strategy | CAGR | Max Drawdown | MAR |
|---|---|---|---|
| Strategy A (1%) | 22.8 % | 13.8 % | 1.65 |
| Strategy B (1%) | 34.4 % | 17.6 % | 1.95 |
| Combined (1% each) | 65.3 % | 8.9 % | 7.36 |
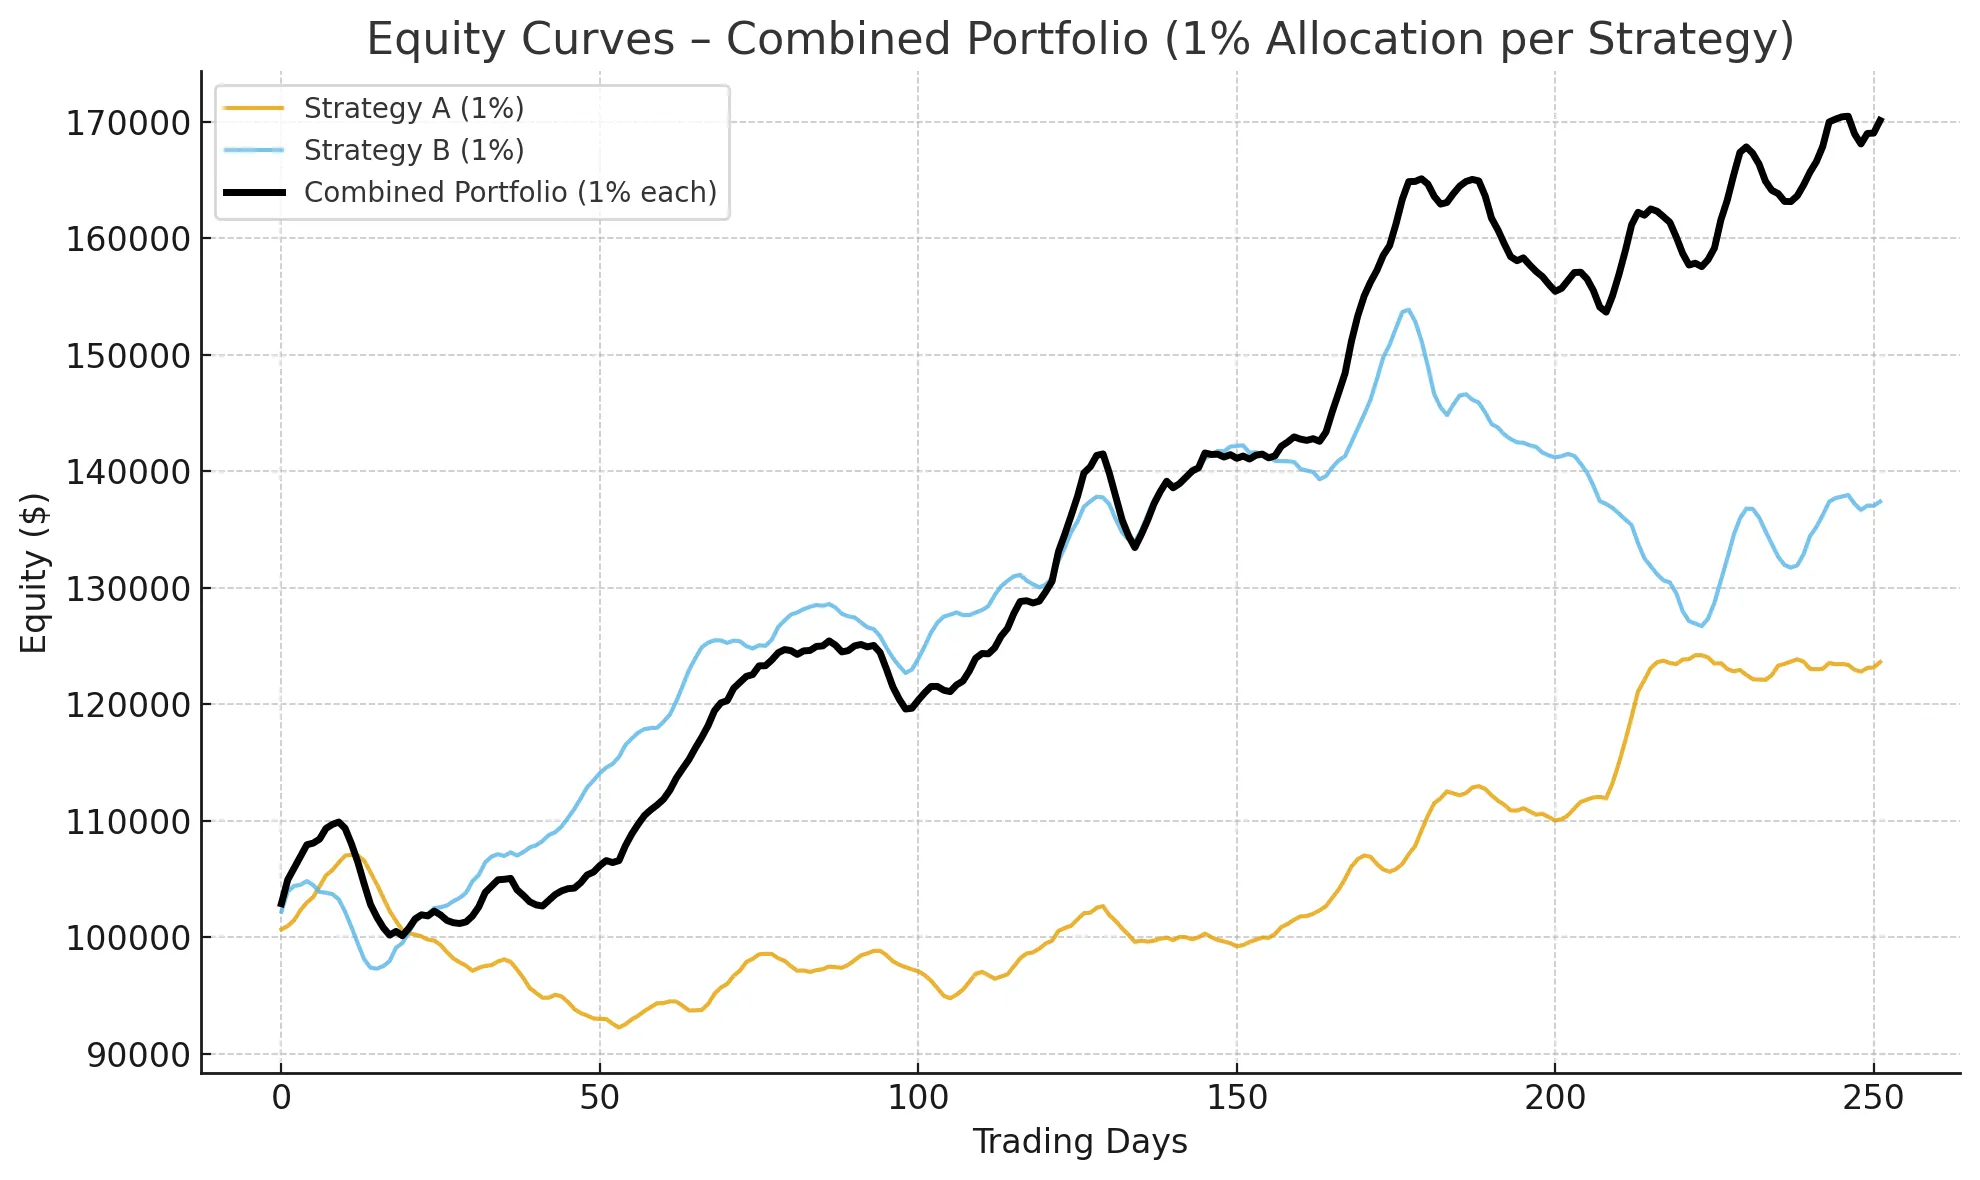
We see a powerful principle in action: the whole is greater than the sum of its parts.
By combining both strategies, the portfolio doesn't just double the CAGR of each individual system - it does so while reducing the overall drawdown to just ~9%, and boosting the MAR from below 2 to an impressive 7.36.
In other words, we’ve achieved substantially more return with significantly less risk.
How is that possible?
Because the losing periods of one strategy often coincide with the winning periods of the other, naturally smoothing the equity curve and creating a more stable performance profile.
Diversifying across uncorrelated, positively expectant strategies creates a self-reinforcing effect:
Drawdowns shrink and smooth out, as losses in one system are often offset by gains in another.
Compounding becomes more efficient, since equity stays higher and less time is spent recovering from deep losses.
Volatility and emotion both decline, leading to greater confidence, discipline, and consistency — key ingredients for long-term scalability.
Lower overall volatility, in turn, makes your results more predictable — allowing you to plan realistically. You can estimate sustainable withdrawals or reinvestment targets with greater confidence, without slowly draining your portfolio over time.
The goal of mixing strategies isn’t simply to chase higher returns - it’s to get more for less. Whether by raising returns, reducing drawdowns, or ideally both, we want more reward per unit of risk.
Reality Check: Correlation Never Disappears
In practice, perfect de-correlation doesn’t exist.
At times, multiple strategies will lose together - just as they might win together.
That’s why it’s crucial to validate the combined historical drawdowns and ensure they’re within your emotional and financial limits.
Also, always leave a margin of safety for moments when correlations unexpectedly rise.
Even strategies that appear uncorrelated in backtests can become synchronized under stress, especially during market-wide shocks, liquidity crunches, or volatility spikes. In those moments, what once acted as a diversifier may suddenly move in the same direction as everything else - amplifying risk instead of reducing it.
By maintaining a buffer in your sizing, leverage, or overall risk exposure, you protect yourself from these correlation surprises and ensure your portfolio remains resilient when it matters most.
“Let’s Add a Hundred Strategies!”
After seeing how well two strategies blend, you might think:
“Why stop there? Let’s add a hundred!”
But that’s the diworsification trap - over-diversifying to the point where you dilute your edge into statistical noise.
Each additional strategy typically contributes less and less incremental benefit, especially as correlations creep in or as the strategies become too similar in structure or behavior.
Eventually, you’re left mirroring the market, holding a crowded mess of systems with no meaningful alpha - just extra complexity, harder execution, and more room for slippage or mistakes.
Portfolio theory suggest that most of the diversification benefit is captured within the first 5 to 10 truly uncorrelated systems. Beyond that point, additional strategies contribute marginally to risk reduction while increasing complexity and operational overhead.
As a short-term SPX options trader, I focus on scattering my risk — diversifying across deltas, expiries, entry and exit conditions, as well as both long and short strategies. The goal is to build a set of systems that complement rather than amplify one another, reducing exposure to any single type of market risk. Keeping the number of systems to about 10 allows me to stay in control and focus on optimizing and tracking them instead of constantly chasing the next big thing.
A healthy portfolio doesn’t aim for quantity - it’s built around a handful of truly independent, high-expectancy systems:
Enough to smooth the curve, not enough to blur it.
Not Every Shiny Strategy Belongs
Sometimes we find a new “miracle” strategy with a MAR of 15 in isolation, only to discover it adds nothing to the portfolio.
Even if it boosts CAGR slightly, if it also increases Max Drawdown - the MAR of the total portfolio doesn’t improve.
That’s a red flag: the new system’s returns are correlated with existing ones.
Adding it is like turning up the volume on the same song - louder but not necessarily better.
Still, such experiments are valuable - replacing or re-weighting can reveal where real diversification lies.
Summary
Even if no single strategy is the “best in the world,” combining several positively expectant, low-correlation systems lets you achieve the ultimate trader’s goal:
A smoother equity curve with a higher MAR - more return for the same or even lower risk, and less stress along the way.
Because in the long run, it’s not the biggest peaks that make you wealthy.
It’s the absence of deep valleys that keeps you in the game long enough to compound.